OCAR4
Climate
Previously, we checked how well global climate models (GCMs) performed at simulating Northwest climate (Rupp et al. 2013). We then statistically downscaled 20 of the best models using the Multivariate Adaptive Constructed Analogs (MACA, Abatzoglou and Brown 2012) method. OCCRI research partner Prof. John Abatzoglou has led the construction of a “climate toolbox” in which various climate quantities are computed at fine spatial resolution for both a baseline, past dataset and for changes derived each of 20 GCMs, as well as the changes averaged over all 20 GCMs (Figures 2-3).
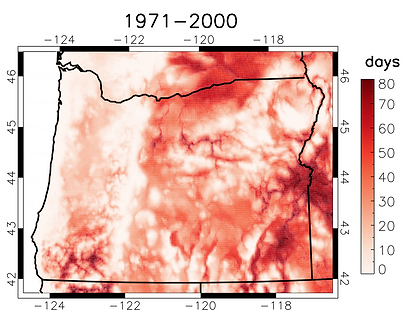
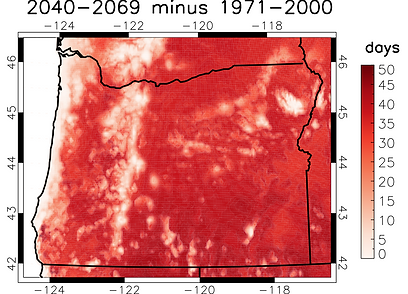
Figure 2 shows how ‘hot days’, defined as the days with daily high temperatures >86F, are expected to change by mid-century (2040-2069) for the high emissions scenario. In the baseline period (1970-1999), the hottest parts of the state — lower elevation portions of eastern Oregon, as well as the Rogue River valley — experience at least 30 hot days per year. In the future, most locations except the mountains and the coast will experience at least an additional 30 hot days per year, in many places doubling the frequency of such days.

The Willamette and Umpqua valleys, along with small coastal valleys, have the longest growing season in the baseline climate, over 280 days (Fig. 3a), and the high elevations of central and Eastern Oregon have the lowest, only a couple of months.
By mid-century in the high-emissions scenario (Fig. 3b), most of western Oregon would see a lengthening of the growing season by about two months. Some of the higher elevation locations in central Oregon would also see a lengthening of about two months, and the rest of the state would see lengthening of about a month. Accompanying these changes is a shift by over a month later in the date of first fall freeze in the highlands of central Oregon (Fig. 3d) and a shift by over a month toward earlier date of last spring freeze in much of western Oregon (Fig. 3f).
To augment the information from GCMs, OCCRI also runs a fine-scaled (25 km) regional model to more accurately simulate the physical processes associated with topography like mountains which influence the responses of the atmosphere (and hence temperature and precipitation) to rising greenhouse gases. Our approach uses a crowd-sourced climate modeling platform to generate a ‘superensemble’, that is, a very large collection of simulations that allows better statistical representation especially of extremes (Mote et al 2015).
Figure 4 shows the seasonal mean changes in temperature from this regional modeling superensemble. These results are for the lower-emissions RCP4.5 scenario, which by mid-century (2030-59) is noticeably lower than RCP8.5. In winter and spring, warming is 10-20% larger in the mountains, especially the Sierras and the Cascades, than in surrounding areas. Analysis indicates that ‘snow-albedo feedback’, in which modest warming is accentuated where snow disappears, is primarily responsible for these changes. In the Northwest (see Table 2.2 of Dalton et al, 2017) as well as globally, the ocean warms less than land. As with many GCMs, our regional model projects larger warming in summer, which leads to sharp spatial contrasts between land and ocean warming across the coastal mountains. In other words, Oregon’s coastal areas will only warm about 0.4°F (0.2°C) per decade, the rest of western Oregon around 0.7°F (0.4°C) per decade, and eastern Oregon more than 0.9°F (0.5°C) per decade. Similar patterns are visible in fall, though with smaller magnitudes.
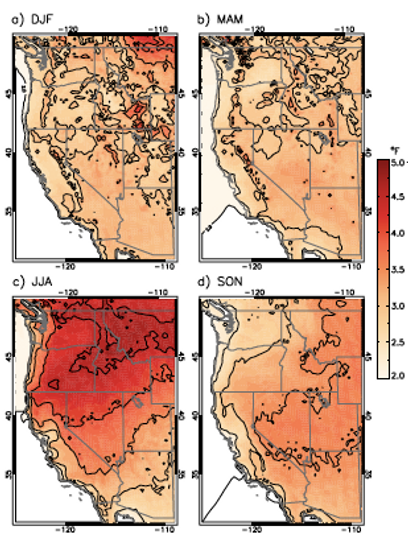
Figure 4 shows the seasonal mean changes in temperature from this regional modeling superensemble. These results are for the lower-emissions RCP4.5 scenario, which by mid-century (2030-59) is noticeably lower than RCP8.5. In winter and spring, warming is 10-20% larger in the mountains, especially the Sierras and the Cascades, than in surrounding areas. Analysis indicates that ‘snow-albedo feedback’, in which modest warming is accentuated where snow disappears, is primarily responsible for these changes. In the Northwest (see Table 2.2 of Dalton et al, 2017) as well as globally, the ocean warms less than land. As with many GCMs, our regional model projects larger warming in summer, which leads to sharp spatial contrasts between land and ocean warming across the coastal mountains. In other words, Oregon’s coastal areas will only warm about 0.4°F (0.2°C) per decade, the rest of western Oregon around 0.7°F (0.4°C) per decade, and eastern Oregon more than 0.9°F (0.5°C) per decade. Similar patterns are visible in fall, though with smaller magnitudes.

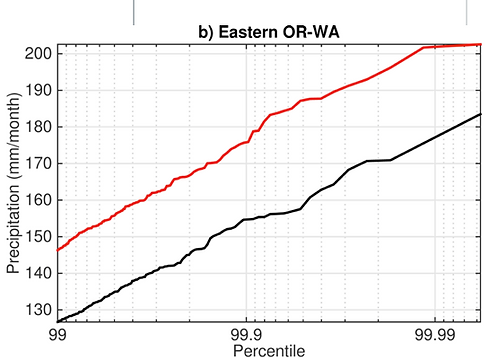
For precipitation (not shown), both the set of global models and our regional model suggested modest increases in winter precipitation and modest decreases in summer precipitation. In addition, our regional modeling results for mid-century suggest a weakened rain shadow effect in winter, with larger increases (>20%) in precipitation east of the Cascades and small (<10%) increases west of the Cascades. These changes in seasonal means are matched by changes in extreme precipitation (Figure 5) which are relatively larger east of the Cascades. For example, the 99th percentile (wettest day in 100 days) goes up 6% west of the Cascades but 14% east of the Cascades.
Observed Climate
Oregon’s warming trend continues. As shown in the observations in Figure 1a, after the record-warm 2015 (the recent peak of the observed temperature graph), calendar years 2016 and 2017 were also warmer than the 1970-1999 average though not as warm as 2015. The temperature of calendar year 2018 is not officially available as of this writing because the continuing lapse in federal appropriations has shuttered the official climate data analysis capabilities of NOAA. However, other sources of data 2 indicate that 2018, too, was warmer than average.
.jpg)
Future Climate
.jpg)
Future warming rates will increasingly depend on global greenhouse gas emissions, as can be seen by comparing the red (high emission RCP8.5) and yellow (low emission RCP4.5) thick curves and shaded regions).
The Paris agreement seeks to achieve warming no greater than 2°C, which would require that emissions track below RCP4.5; consequently, even the yellow curve and shaded region are higher than the scenarios consistent with the Paris Agreement. Annual precipitation, unlike temperature, has no long-term trend toward wetter or drier. Most recent years have been fairly close to average, with the exception of 2018, which was much drier than average based on NOAA data available in December.
Sea Level
Projections for sea level rise to 2050 have not changed substantially in recent years, but new estimates of the maximum physically plausible sea level rise by 2100 are now 8.2 feet (2.5m) (USGCRP 2017, p. 343).
Intermediate estimates are also higher than some previous assessments, 3.3 feet (1.0m) by 2100. Moreover, an improving understanding of the behavior of the Antarctic ice sheet especially in past glacial-interglacial cycles has advanced the understanding of its future response to warming.
A crucial point about both Greenland and Antarctica is that even after global temperatures are stabilized, melting will continue until a new equilibrium is reached. In the case of Greenland, there is growing concern that any warming beyond 1.5-2°C could lead to the irreversible melting of the entire ice sheet: once the melting reduces the altitude enough, the ice sheet cannot accumulate enough new snow in winter to offset the melting in summer.
In the case of Antarctica, recent research by Oregon scientists (Clark et al. 2018) shows that the equilibration to a new climate would take thousands of years. Their analysis suggests that stabilizing global climate at 2°C above preindustrial would limit sea level rise to less than 3.3 ft (1m) by 2300, but even so, it could reach 9m by the year 9000. Higher emissions scenarios could lead to increases in global mean sea level of almost 10m by the year 2500 and over 50m by the year 9000. The authors note that the policy consequences of limiting emissions now will last for millennia.
.jpg)